Technical Analysis
The 5 Essential Technical Indicators for Trading Crypto
Five indicators do most of the heavy lifting. Master RSI, MACD, Bollinger Bands, Volume and Moving Averages — with crypto-specific tips — and you'll read almost any chart with more confidence.
The 5 Essential Technical Indicators for Trading Crypto
Technical analysis applied to cryptocurrencies shares the same foundations as in the stock market, but with particularities tied to the asset class's extreme volatility.
1. RSI (Relative Strength Index)
The RSI measures the speed and magnitude of price moves over a period (default: 14 days).
- RSI > 70: overbought zone → caution or partial profit-taking signal
- RSI < 30: oversold zone → potential rebound zone
Crypto tip: In a strong bull market, the RSI can stay in the overbought zone (70–90) for weeks. Don't exit too early.
The RSI is one of the components of Fynov's FynovScore™ in the technical dimension. An asset with an RSI in the oversold zone combined with a rising FynovScore sends a more reliable signal than RSI alone.
2. MACD (Moving Average Convergence Divergence)
The MACD identifies momentum shifts via two exponential moving averages.
- Bullish crossover (MACD > Signal): upward momentum signal
- Bearish crossover (MACD < Signal): downward momentum signal
- Divergence: when price makes new highs but the MACD doesn't → possible reversal
3. Bollinger Bands
They frame the price within an envelope of 2 standard deviations around the 20-day moving average.
- Price at the lower band: potential rebound (mean reversion)
- Squeeze (very tight bands) → strong volatility imminent
- Breakout beyond the bands: continuation of the move or reversal
4. Volume
Volume validates or invalidates a price move:
- A rise on high volume = strong and durable move
- A rise on low volume = suspicious, possible false breakout
Use the OBV (On-Balance Volume) to anticipate reversals.
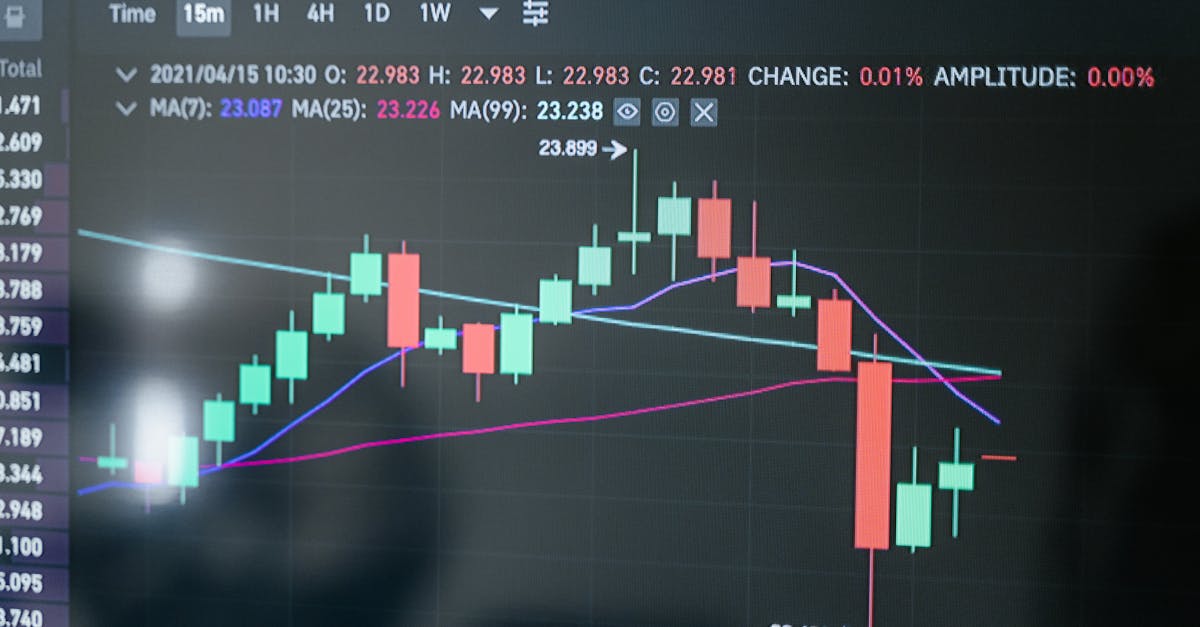
5. Moving Averages (MA50 / MA200)
Moving averages smooth out the noise and identify the trend.
- Golden Cross: MA50 crosses above MA200 → major bull signal
- Death Cross: MA50 crosses below MA200 → major bear signal
- Price above the MA200 = long-term uptrend
Combining the indicators with FynovScore™
These five indicators feed the technical read of Fynov's FynovScore™, one of the two reads (technical and AI) blended into the final score. Look for confluences: an oversold RSI + a bounce off the MA200 + rising volume = a far more reliable signal than any single indicator in isolation.
On Fynov, the AI Signals section contextualises these indicators in plain language: instead of reading 5 charts separately, you read the reasoning generated by the AI directly.
FAQ
Which technical indicator is the most reliable?
None on its own. The edge comes from confluence — for example an oversold RSI plus a bounce off the MA200 plus rising volume is far more trustworthy than any single indicator in isolation.
Why can RSI stay "overbought" for weeks in crypto?
In a strong bull market, momentum is relentless: RSI can sit in the 70–90 zone for weeks. Treat overbought as a caution flag, not an automatic exit.
How do these indicators relate to the FynovScore™?
They feed its technical read, which is blended with an AI read across five dimensions (technicals, macro, sector, news, fundamentals) so a single false signal doesn't dominate.
Note: Technical analysis does not guarantee future results. Always use protective stops.